Create Organizational Chart with React D3 Tree

Imam Setiawan
28 January, 2025
blog cover

In today’s dynamic business landscape, organizational charts are more than just static diagrams — they are essential tools for ensuring clarity, boosting productivity, and fostering better communication across teams. An effective organizational chart does more than display titles and hierarchies; it helps employees understand reporting relationships, visualize collaboration structures, and identify decision-making pathways. For instance, in a growing company with multiple departments, an organizational chart can help new hires quickly grasp who to contact for specific tasks or approvals. Similarly, in project-based work environments, dynamic organizational charts can streamline communication by showing cross-functional team structures.

Whether it’s a sales team tracking key managers and their responsibilities, or an engineering department mapping out specialized roles, having a well-organized and interactive chart makes a significant difference in operational efficiency. Recognizing this need, modern applications like AlurKerja integrate powerful organizational chart features to give teams a seamless way to visualize their structures, collaborate, and adapt to changes in real time.

But what if you want to build your own custom organizational chart feature? Whether you’re a developer looking to enhance your app or a curious learner, this guide will walk you through the steps to create an interactive organizational chart using JavaScript (or React in this example). We will use React D3 Tree library which is a React component that lets us represent hierarchical data (e.g. family trees, organizational charts, file directories) as an interactive tree graph with minimal setup, by leveraging D3’s tree layout.
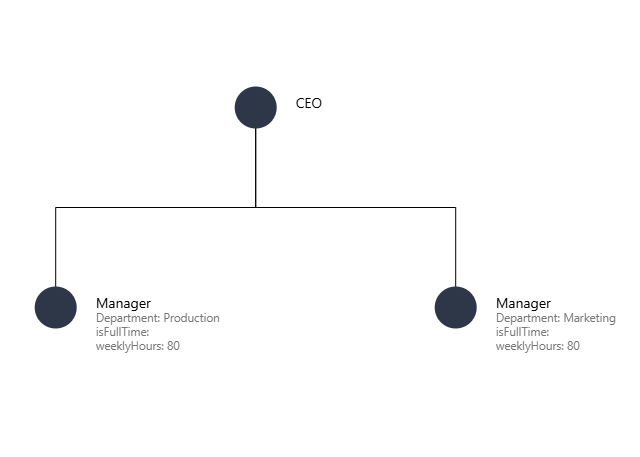

Hierarchial Tree built with React D3 Tree

For this example, you can use new React project or integrate this into your existing React project.


Step 1: Install Dependencies

First, install react-d3-tree:

npm install react-d3-tree

Step 2: Create the Data Structure

react-d3-tree uses a hierarchical JSON structure to define the nodes and their relationships. Here’s an example of the data for an organization chart:

const orgChartData = {
  name: "CEO",
  children: [
    {
      name: "VP of Marketing",
      children: [
        { name: "Marketing Manager 1" },
        { name: "Marketing Manager 2" },
      ],
    },
    {
      name: "VP of Sales",
      children: [
        { name: "Sales Manager 1" },
        { name: "Sales Manager 2" },
      ],
    },
    {
      name: "VP of Engineering",
      children: [
        {
          name: "Engineering Manager",
          children: [
            { name: "Software Engineer 1" },
            { name: "Software Engineer 2" },
          ],
        },
      ],
    },
  ],
};

Step 3: Create the Organization Chart Component

Create a new React component to render the organization chart. Let’s call it OrgChart.js:

import React from "react";
import Tree from "react-d3-tree";

const containerStyles = {
  width: "100%",
  height: "100vh",
};

const OrgChart = () => {
  return (
    <div style={containerStyles}>
      <Tree
        data={orgChartData}
        orientation="vertical"
        translate={{ x: 400, y: 50 }}
        nodeSize={{ x: 200, y: 200 }}
        pathFunc="step"
      />
    </div>
  );
};

export default OrgChart;

Explanation:

  1. Container Styles: Ensure the chart scalses correctly to fit the screen.
  2. Tree Component:
    - data: Pass the hierarchial JSON data
    - orientation: Specifies the tree layout direction (horizontal or vertical)
    - translate: Adjusts the initial position of the tree
    - nodeSize: Customizes the spacing between nodes
    - pathFunc: Controls the link style (e.g., “diagonal”, “step”, etc.). Visit this link to see the visualization of each.

Step 4: Use the Organization Chart Component

Use the OrgChart component in your main App.js file:

import React from "react";
import OrgChart from "./OrgChart";

const App = () => {
  return (
    <div className="App">
      <h1>Organization Chart</h1>
      <OrgChart />
    </div>
  );
};

export default App;

Start the development server to view your interactive organization chart.

Step 5: Customize Nodes

If you have needs to customize how each node is rendered, you can customize it by using the renderCustomNodeElement props. For example:

import React from "react";
import Tree from "react-d3-tree";

const renderForeignObjectNode = ({ nodeDatum }) => (
  <g>
    <foreignObject width={250} height={400} x={-125}>
      <div style={{ border: "1px solid #ccc", padding: "10px", borderRadius: "5px" }}>
        <strong>{nodeDatum.name}</strong>
      </div>
    </foreignObject>
  </g>
);

const OrgChart = () => {
  return (
    <div style={{ width: "100%", height: "100vh" }}>
      <Tree
        data={orgChartData}
        orientation="vertical"
        renderCustomNodeElement={(rd3tProps) =>
          renderForeignObjectNode({ ...rd3tProps })
        }
      />
    </div>
  );
};

export default OrgChart;

This example renders nodes with custom styles using foreignObject to inject HTML.

Step 6: Add Interactivity

react-d3-tree supports various event listeners for interactivity. For instance, you can log node data on click:

const handleNodeClick = (nodeData) => {
  console.log("Node clicked: ", nodeData);
};

<Tree
  data={orgChartData}
  orientation="vertical"
  onNodeClick={handleNodeClick}
/>

For complete documentation: https://github.com/bkrem/react-d3-tree

Conclusion

With react-d3-tree, creating an organization chart is straightforward and highly customizable. You can style nodes, adjust layout settings, and add interactivity to meet your requirements. Experiment with the library to create unique and dynamic visualizations for your hierarchical data!

Ready to Digitally Transform Your Business Processes?

Join 100+ companies already experiencing maximum productivity

WEEKLY INSIGHTS

Get insights on business process management tailored to your role, industry, and challenges.

Choose the topics that matter most to your work. Each week, AlurKerja will send practical insights tailored to your responsibilities and organizational context.

One email per week. Update your preferences anytime.

About You

This information helps us tailor the perspective and context of the insights provided.

Your Role * Select one.

Organization Type * Select one.

Customize Your Insights

Choose the industry and topics most relevant to your work.

Industry or Organization Field * Select one.

Topics You Want to Follow *

Select up to three topics most relevant to your work.

What Are You Currently Facing?

What process challenge is most felt in your organization right now? *

Select one main challenge.

Required for B2B segmentation.

Your Weekly Insight has been personalized.

From now on, we will prioritize insights for:

Industry:

Topics:

Email pertama akan dikirim sesuai jadwal Weekly Insight berikutnya. Anda dapat memperbarui pilihan industri, topik, atau peran melalui tautan "Atur Preferensi" di setiap email.

Read Latest Insights

Facing process challenges that need to be resolved immediately?

Discuss with AlurKerja Team